Free printable and online worksheets to help Grade 7 students review how to identify proportional and non-proportional relationships in graphs. Examples of relationships that are proportional as well as those that are not.
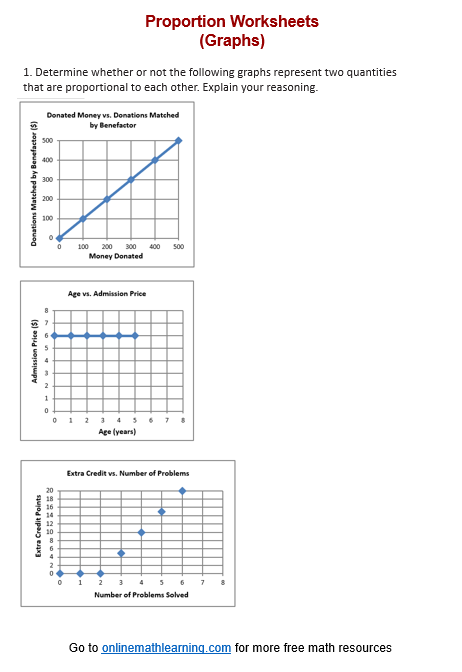
A proportional relationship between two variables is one where the ratio of the two variables is constant. Graphically, this relationship is represented by a straight line that passes through the origin (0,0).
Characteristics of Proportional Relationships on a Graph
Click on the following worksheet to get a printable pdf document.
Scroll down the page for more Proportional Relationships Worksheets.

Try the free Mathway calculator and problem solver below to practice various math topics. Try the given examples, or type in your own problem and check your answer with the step-by-step explanations.
We welcome your feedback, comments and questions about this site or page. Please submit your feedback or enquiries via our Feedback page.